We have in previous blogspot discussed bars in the context of optimization of cross section area. We are now back to the bar, but in another meaning than before. Sorry to disappoint you guys, but we will not go to the bar to have a drink. Instead we will go to the gym and grab a barbell. So, the gains are waiting for you.
To lift a lot you have to lift a lot
Olympic weightlifting is a sport that targets a lot of different abilities. To be able to lift big weights you need to be fast, strong, flexible, have good coordination and timing among other things. Below you can see Lydia Valentin performing a 137 kg clean and jerk at the 2017 european championship. This massive weight is handled with grace and ease even though it is close to twice her body weight. So enjoy a mayestic performance captured by Hookgrip.
Can Python help you out in the gym?
So how can coding in Python help your performance in the gym? Well, looking at the lift performed by Valentin, the bar is traveling close to the body and the bar does not move too much in the lateral direction. One aspect that would be interesting to investigate is the bar path and here perhaps the use of image analysis could be a way forward. To test this out, unfortunately we will not use a world class lifter but rather a more mediocre one, namely me.

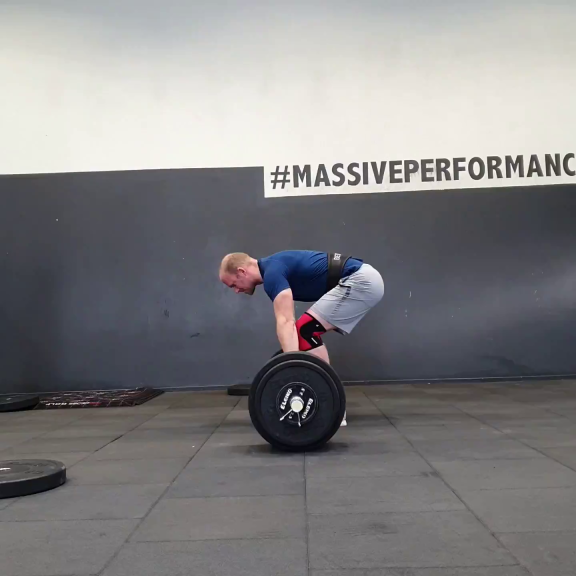
Looking at the picture above, the bar shows good contrast against the black bumper plates. That facts make me quite convinced that the bar will be possible to track during the lift. Let’s fire up Jupyter notebook and start to work on the task.
Let's find the (bar) path
There exists a number of packages in python that can be used for image analysis. In this post we will use the opencv packages for the task ahead. To kick this off, let's start by doing some imports and read a single frame from a movie clip containing a lift.
import cv2
import numpy as np
import matplotlib.pyplot as plt
import copy

import matplotlib as mpl
mpl.style.use('classic')
%matplotlib inline

# Open the video and read the first frame
cap = cv2.VideoCapture('Bar5.mp4')
ret, frame = cap.read()

# The picture is somewhat large, lets resize it...
scale_percent = 40            # percent of original size
width = int(frame.shape[1] * scale_percent / 100)
height = int(frame.shape[0] * scale_percent / 100)
dim = (width, height)
resized = cv2.resize(frame, dim, interpolation = cv2.INTER_AREA)

cv2.imshow('Start',resized)
cv2.waitKey(0)
cv2.destroyAllWindows()
The next step is to define some strategy to identify the bar and track it throughout the lift. One quiet rudimentary but possible way forward would be something like:
- “Help the code out” by manually picking the starting point of the bar
- Create a area of interest in the proximity of this starting point. Here a circular area seems to be a good choice
- Mask the rest of the picture
- Identify the center of the bar
- Move the area of interest to match the new bar position
- Repeat the steps from the second point and onwards for all frames in the movie
This looks like a plan, so let's get to it. Start by attacking the first three bullet points above. The first thing we will do is to convert the picture from BRG to HVS color format. This will in general make the identification of the bar easier. We will aslo apply some filter to the picture to make it easier to work with. Then lets create a new picture where only the area close to the bar center is shown. This is done in the code below
blurred = cv2.GaussianBlur(resized, (11, 11), 0)
hsv = cv2.cvtColor(blurred, cv2.COLOR_BGR2HSV)

test1 = copy.deepcopy(hsv)

# Show only the area if interest
ma = np.zeros_like(test1)
ma = cv2.circle(ma, center_coordinates, 30, (255,255,255), -1)
res = cv2.bitwise_and(resized, ma)

cv2.imshow('Area if interest',res)
cv2.imshow('Original',resized)
cv2.waitKey(0)
cv2.destroyAllWindows()
Below the picture before and after applying the code above can be seen. I will plot this in BRG setting.
Now plot the different component of the HVS to find thresholds (upper and lower limits) for identification of the center of the bar. The code shows an example of plotting the first component.
plt.figure(figsize=(12,8))
plt.imshow((hsv[:,:,0]))
plt.colorbar()
plt.clim([0,255])
Below the three components can be seen.
Not too bad. Looks like it would be possible to identify the center of the bar using the third component only and filer out values below approximately 200. Lets try that.
Lower = (0, 0, 200)
Upper = (255, 255, 255)

# Keep only values in interval of interest
mask = cv2.inRange(res, Lower, Upper)
mask = cv2.erode(mask, None, iterations=2)
mask = cv2.dilate(mask, None, iterations=2)
mask_resized = cv2.resize(mask, dim, interpolation = cv2.INTER_AREA)
And this is what the result looks like
This actually looks really good! The center of the bar is the only thing highlighted in the first picture. Fortunately for us, opencv has built in tools to identify the coordinates for the “blob” representing the bar
M = cv2.moments(mask_resized)
# calculate x,y coordinate of center
cX = int(M["m10"] / M["m00"])
cY = int(M["m01"] / M["m00"])
That is more or less it! Now the final step is just to put this together in a loop over all the frames for the movie and simply plot out the position of the center of the bar as we go along. The entire code is shown below.
cX_vec = []
cY_vec = []

# Set the upper and lower limit
Lower = (0, 0, 200)
Upper = (255, 255, 255)


# Create a VideoCapture object and read from input file
cap = cv2.VideoCapture('Bar5.mp4')

# "Help the code out" where the bar is located in the first frame
center_coordinates = (296, 405)
radius = 5
color = (128, 105, 220)
thickness = 2
iii = 0

# Read until video is completed
while(cap.isOpened()):
    # Capture frame-by-frame
    ret, frame = cap.read()
    if ret == True:

        iii+=1

        scale_percent = 40 # percent of original size
        width = int(frame.shape[1] * scale_percent / 100)
        height = int(frame.shape[0] * scale_percent / 100)
        dim = (width, height)

        # resize image
        resized = cv2.resize(frame, dim, interpolation = cv2.INTER_AREA)
        blurred = cv2.GaussianBlur(resized, (11, 11), 0)
        hsv = cv2.cvtColor(blurred, cv2.COLOR_BGR2HSV)

        # Plot a cirkle
        test1 = copy.deepcopy(hsv)
        ma = np.zeros_like(test1)
        ma = cv2.circle(ma, center_coordinates, 35, (255,255,255), -1)
        res = cv2.bitwise_and(test1, ma)

        # Mask the stuff outside of the cirkular area of interest
        mask = cv2.inRange(res, Lower, Upper)
        mask = cv2.erode(mask, None, iterations=2)
        mask = cv2.dilate(mask, None, iterations=2)
        mask_resized = cv2.resize(mask, dim, interpolation = cv2.INTER_AREA)

        # Calculate x,y coordinate of center
        M = cv2.moments(mask_resized)
        cX = int(M["m10"] / M["m00"])
        cY = int(M["m01"] / M["m00"])

        cX_vec.append(cX)
        cY_vec.append(cY)

        for i in range(len(cX_vec)):
            resized = cv2.circle(resized, (cX_vec[i],cY_vec[i]), 4, (0,0,255),-1)


        center_coordinates = (cX,cY)

        cv2.imshow('Frame',resized)
        cv2.waitKey(30)


    # Press Q on keyboard to  exit
    else:
        break
# When everything done, release the video capture object
cap.release()
#Closes all the frames
cv2.destroyAllWindows()
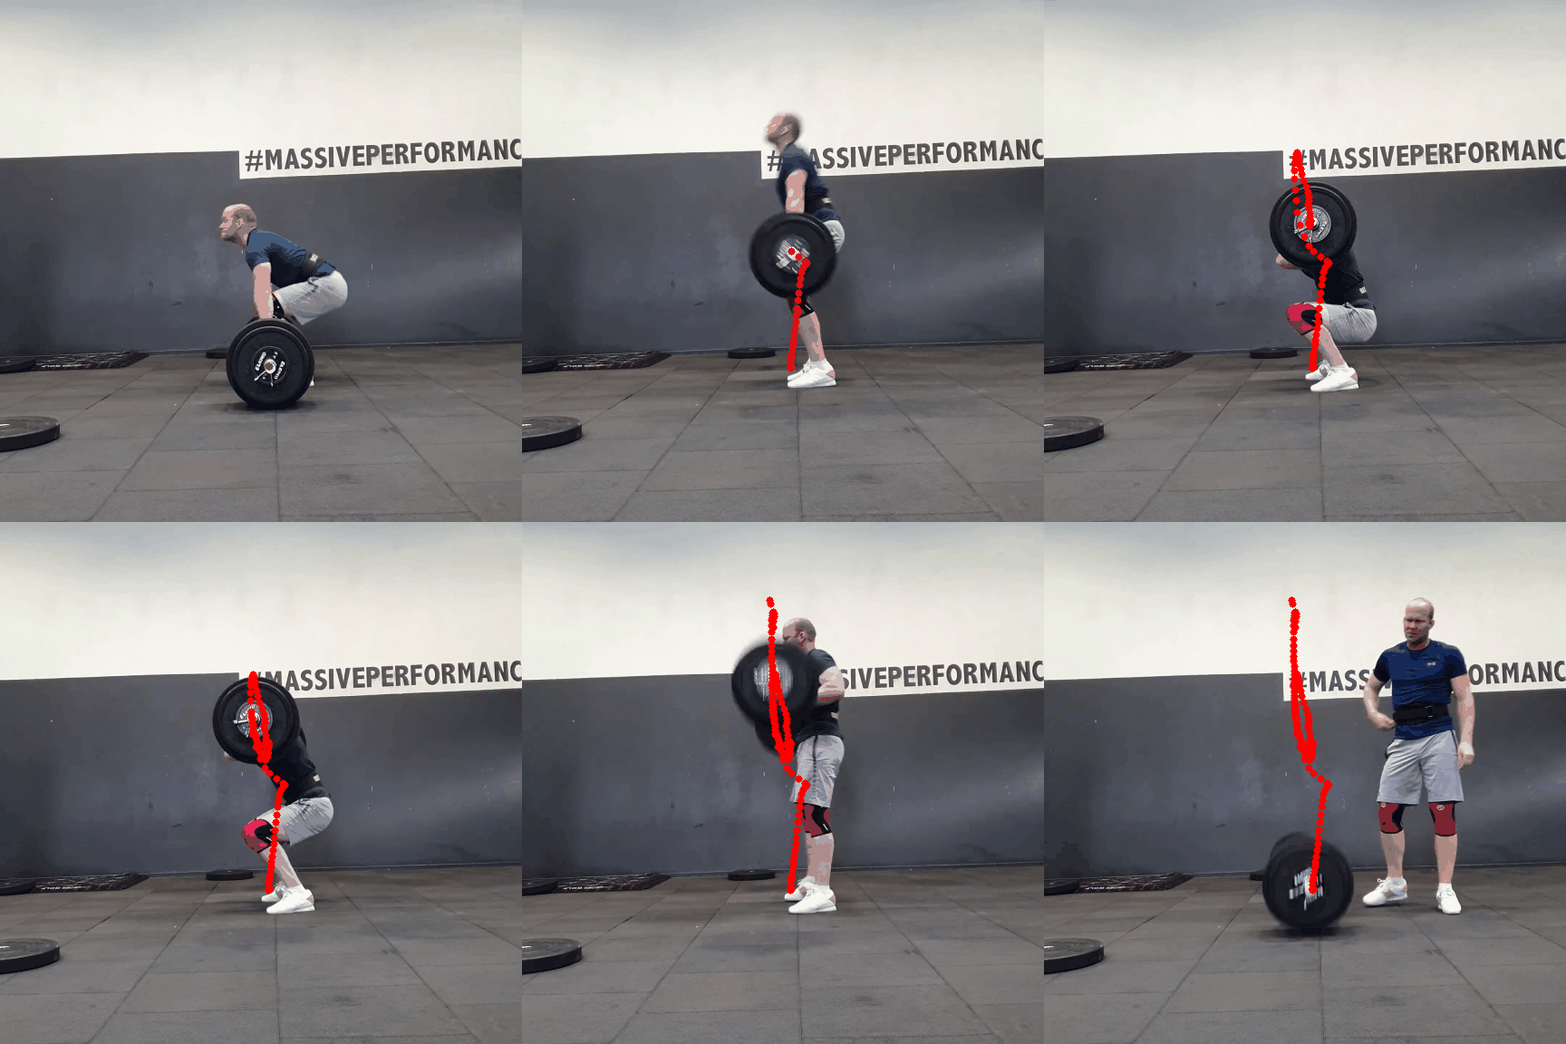
And here is the final result!

Not too bad. I think we have accomplished what was set up as a task in the beginning of the post. The technique of the lift can of course be improved a lot. A clean at 115 kg (bodyweight 93 kg) is probably not something to be that proud of, but with some help from python coding (and also a great lifting coach) the gains are just around the corner.
Time to conclude
So that's it for this time. Hope you liked this post even though it was a bit different from the previous ones. And as always, please contact us on info@gemello.se if you have any questions or just like to know us better.
Until next time: Eat, lift, (code), sleep and repeat.