This is the second post on the series of “Putting your putting skills to the test”. In the first post, the mechanics of putting was investigated and an implementation in python was shown. In this post, we will try to use the results from the first post to do something cool. So let's get started.
The ones of you playing the game of golf have probably noticed that two different putts can, although having the same length, have significantly different level of difficulty. A straight, slightly uphill putt is preferred over a slippery, sideway and downhill putt. Talking of downhill putts, have a look at this awsome putt by Justin Rose from the Dubai dessert classic in 2016. A real masterpiece, enjoy
Most of the players facing a putt like this one above would have a gut feeling that this is really difficult, but can this be quantified? This bring us to the subject of this post:
Is it possible to construct a metric that in some way set a number on how difficult a putt is?
Finding a concept
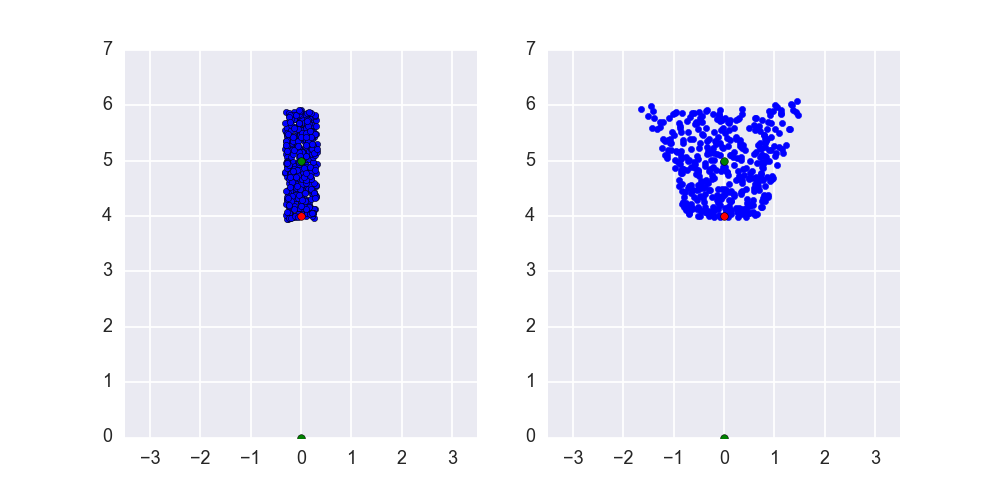
To test this out, let us start by investigating two putts of equal length. The length of the putt is 4 meters, but as you can see, the slope of the two putts are different.
The first one will “correct” the mistakes when it comes to aiming. If the golf ball is, for instance, sent of to far to the right, the slope will bring the ball back on target. Hence this is called “Stable”. The opposite is true for the second putt. Here a mistake will be “magnified” and therefore the name "Unstable". Asking out engineering gut feeling, the first one is expected to be simpler that the second one, but can we put a number of the difference in difficulty? Let’s fire up a jupyter notebook and get to it!
The code used in this blog post will be just smaller variations of what could be found in the first blog post on this subject. Let's start by looking at the equations of motion:
Here the only difference from the code in the first post is that the slope of the green is computed using the gradient of the putting surface. The conceptual idea is now to find the “optimal” starting parameters, in this case a putt that is holed with enough speed to go approximately one meter past the hole. From this “optimal” setting, the initial angle and initial speed is variated. Here the starting angle will vary between -7 and 7 degrees and the speed is varying plus/minus 10%. Then a number of simulations are done and the final position of the golf ball is recorded. The code to do this can be seen below
Plotting the result of all recorded end positions from the simulation, it is expected that the variation will be much bigger for the “unstable” putt. It is also expected that the average distance from the hole (or in this case an imaginary spot one meter past the hole) will be larger for the unstable green compared to the stable.

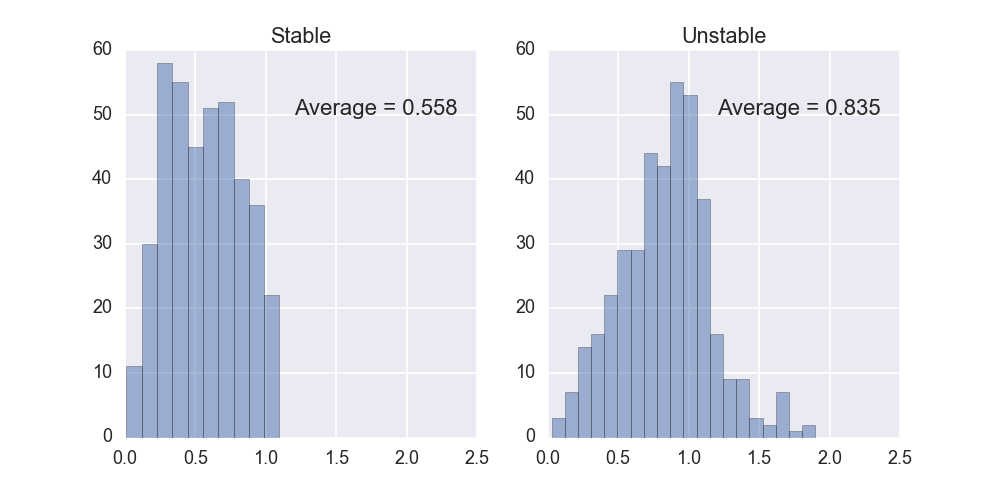
A histogram of the distance can be seen below where, in this case, 400 simulations has been used for both green versions.

As can be seen, the average is lower for the stable setting as would be expected. OK, perhaps we now have found some way to identify the difficulty of a putt. Next step would be to test the concept for a more realistic putting surface.
A more realistic putting surface
OK. Let's put this concept to the test using something that looks more like a “real” putting surface. Below this (not so “real”) putting surface can be seen. In addition to the surface, there is 8 positions marked which all have the same distance from the hole (marked in yellow). There is also the result from simulating putting from position 1 and position 7. Here the same variation (plus/minus 7 degrees for the aiming and plus/minus 10% for the speed) has been used.
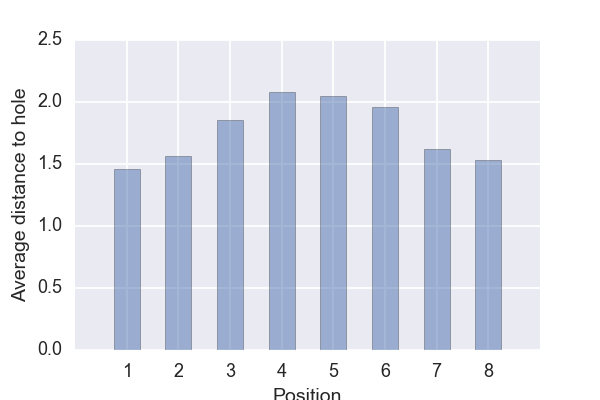
It is clear that the spread for the end position is larger for the putts started from position 7 (marked in green) than for the putts starting from position 1 (marked in blue). Now let's perform the same type of analysis for all the 8 positions and then compare the average distance to the hole.

Alright! Not to bad. The results do not contradict an average golfers intuition (the average golfer, in this case, being me). It would be expected that the putt from position 1 is the simplest one, since it is the one that most resemble the “stable” example above. It would also be expected that putts from position 4-6 would be the most difficult ones, since they more resemble the “unstable” example.
Time to conclude
This was the second and (perhaps) the last part of the how simulations can help your golf game. Hope you enjoyed this post and as usual, if you have questions or comments please contact us. See you guys soon. Until then: Fore!!